
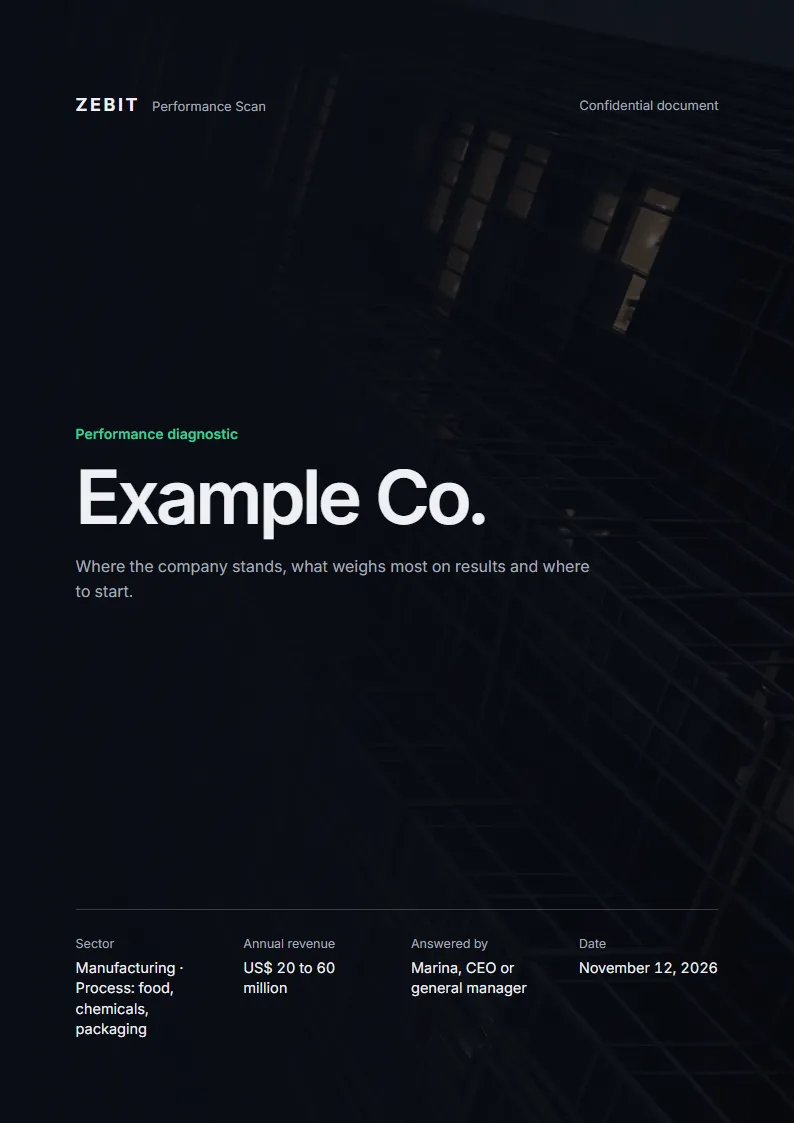
Executive report, on screen and as a PDF
Cover, summary, a snapshot by dimension, a map of the thirty levers, priorities, a 90-day roadmap and an appendix with every answer. A document for the leadership team's agenda.
Free Performance Scan
A ten-minute performance diagnostic, by tap or by voice. The questions adapt to your sector and revenue, and the report is ready on the spot, with three priorities and the evidence behind each one.
Free. No commitment. Instant report, on screen and as a PDF.
Tailored questions for 13 sectors
The problem
Revenue grows, margin falls, and no one can say whether the problem is pricing, costs or mix.
Money gets stuck in inventory, customer payment terms and interest. The shortfall only shows up the week the cash runs out.
Decisions go up to the partners, the same problems come back every month, and the company grows only as far as your calendar allows.
How it works
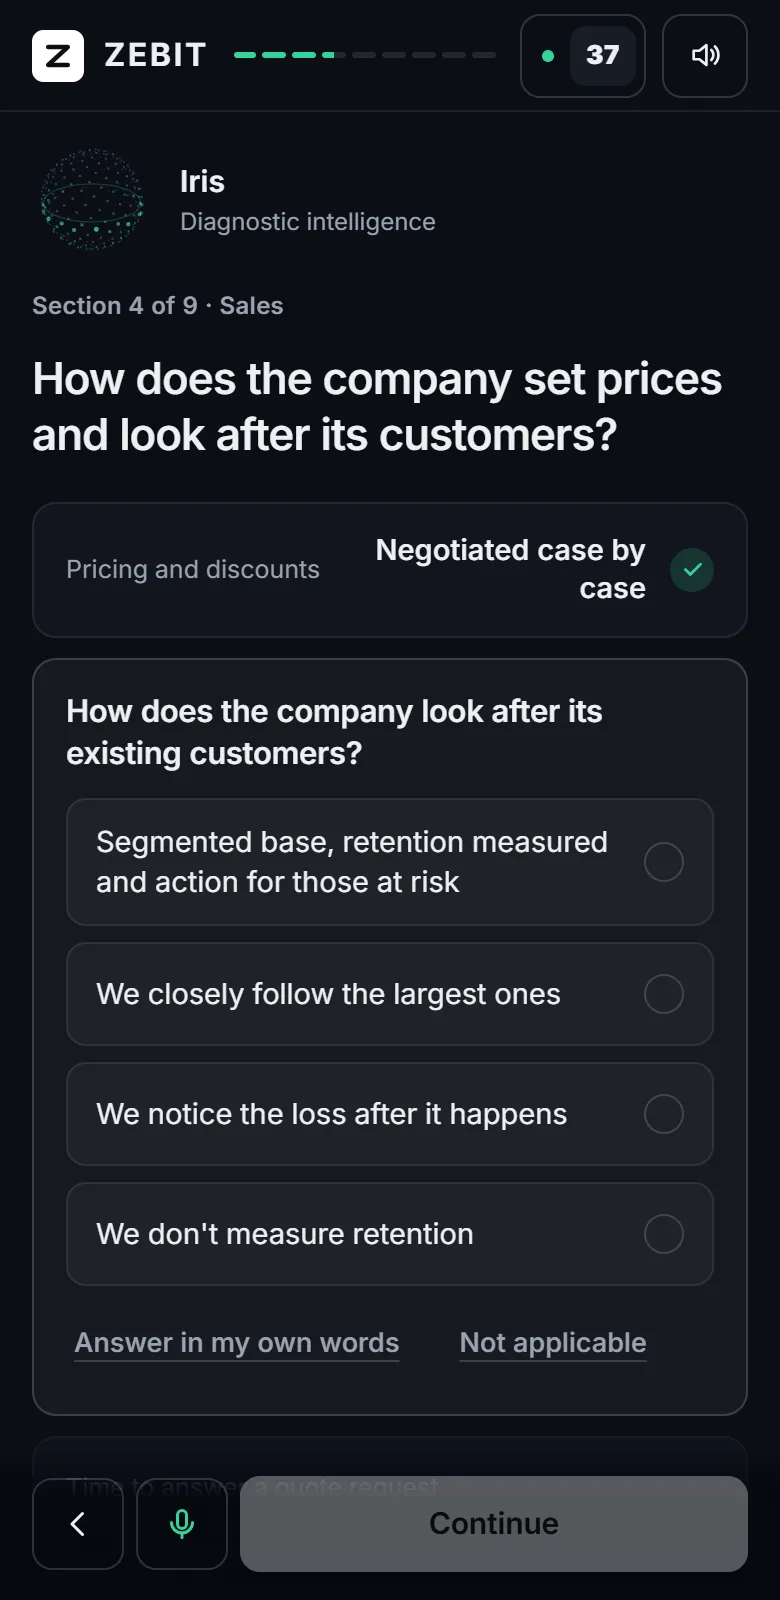
ZEBIT's diagnostic intelligence leads the conversation by voice, one direct question at a time. No spreadsheet to fill in and no exact figure to provide.
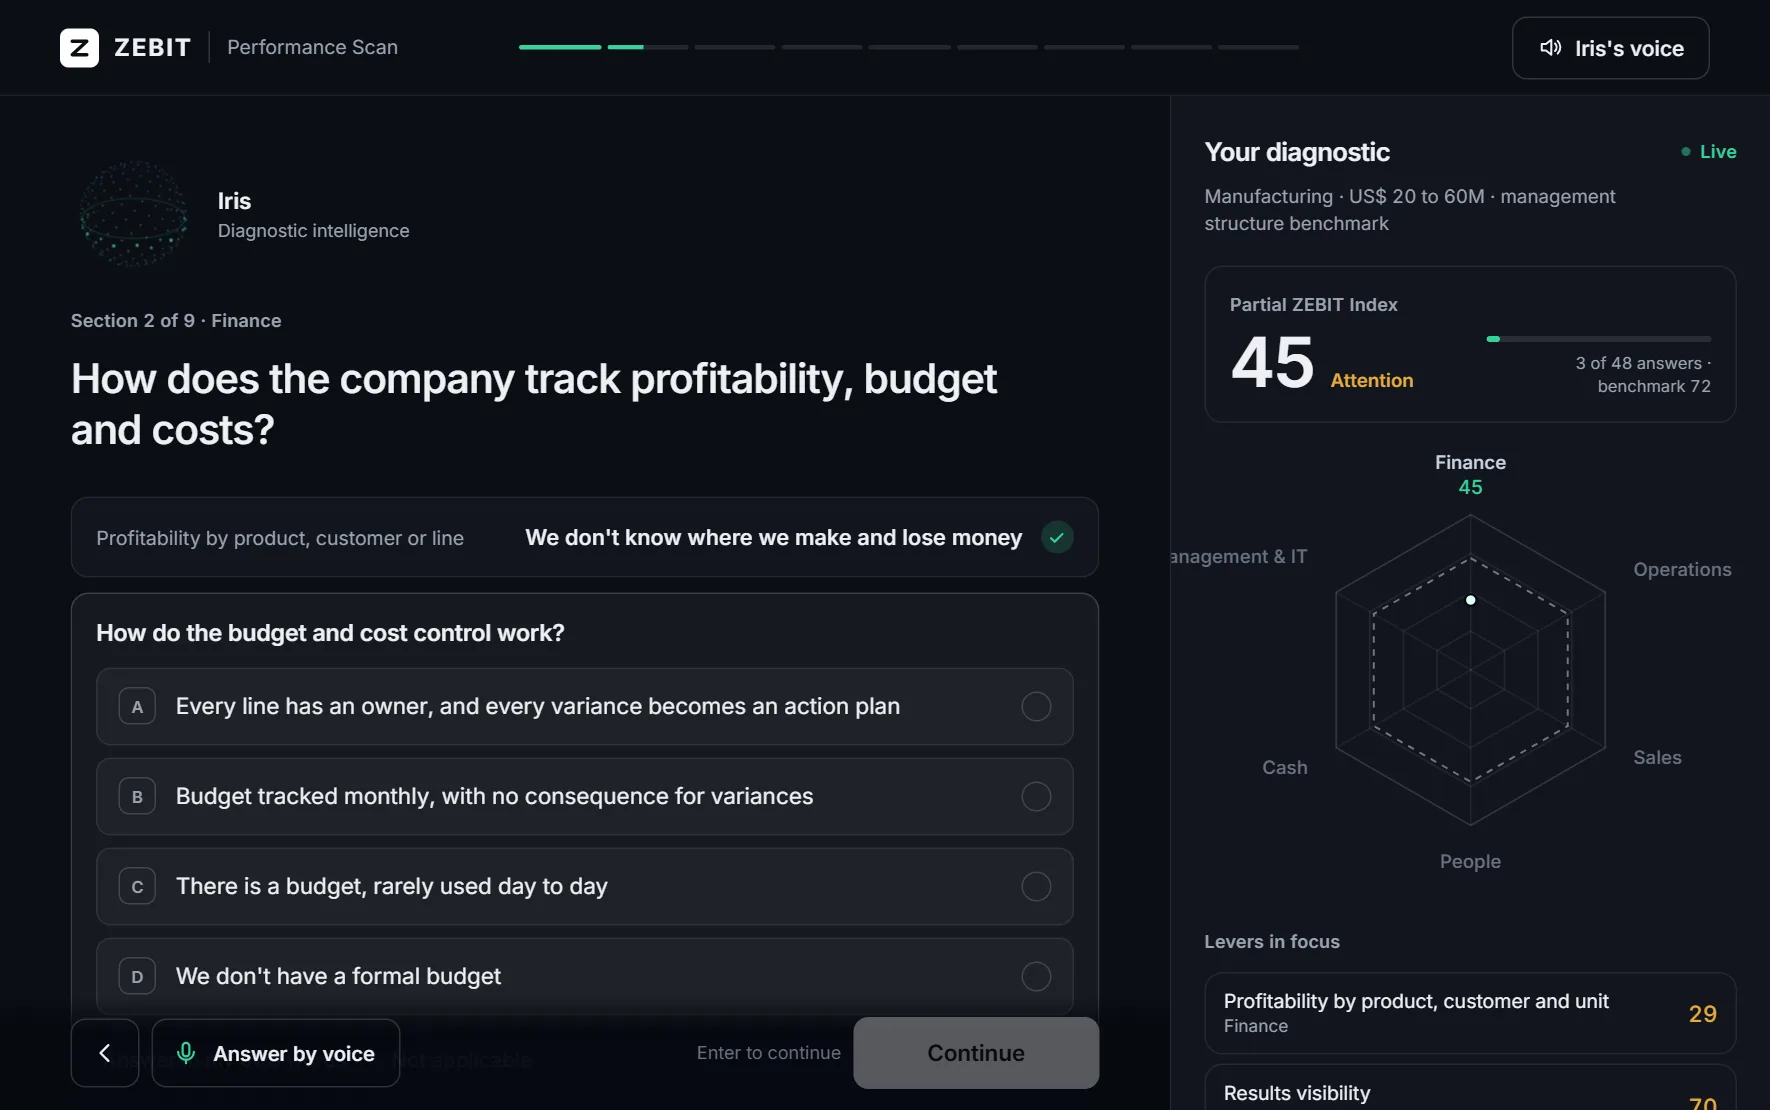
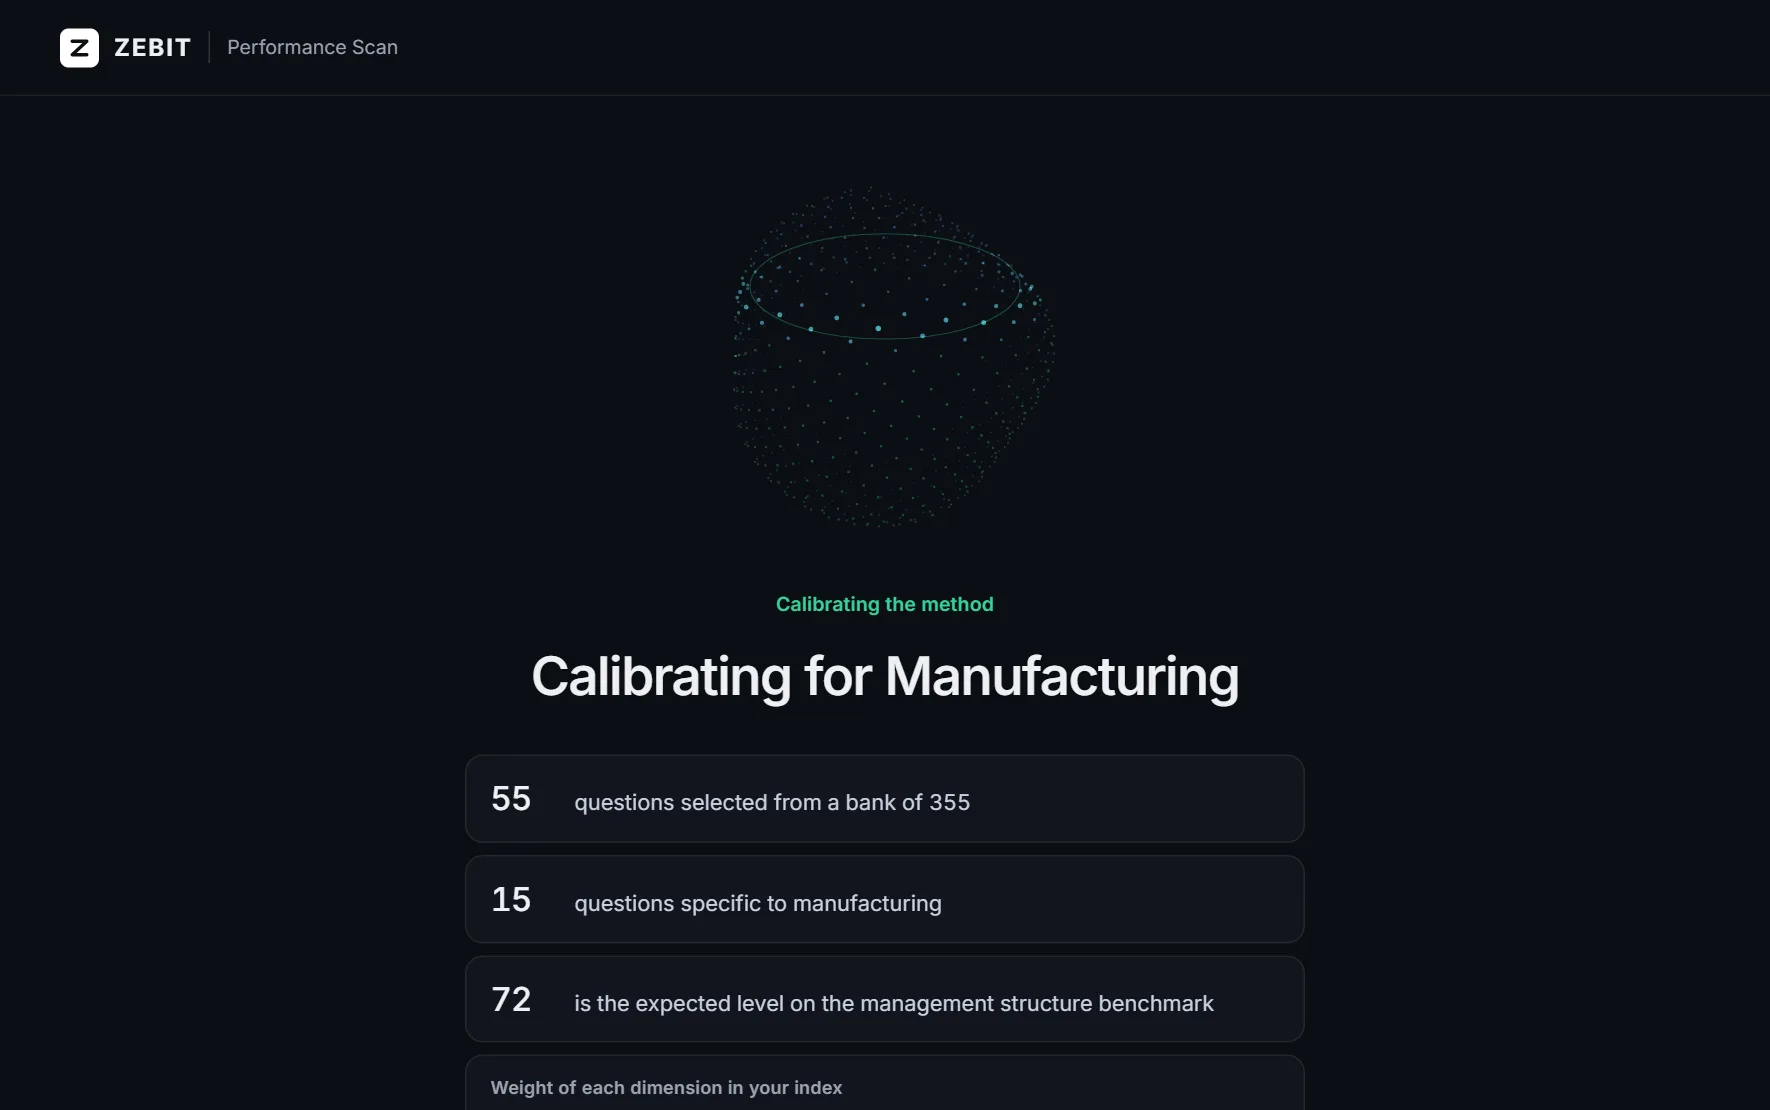
Sector, business model and revenue choose the questions, the vocabulary, the weight of each dimension and the benchmark your company is measured against.
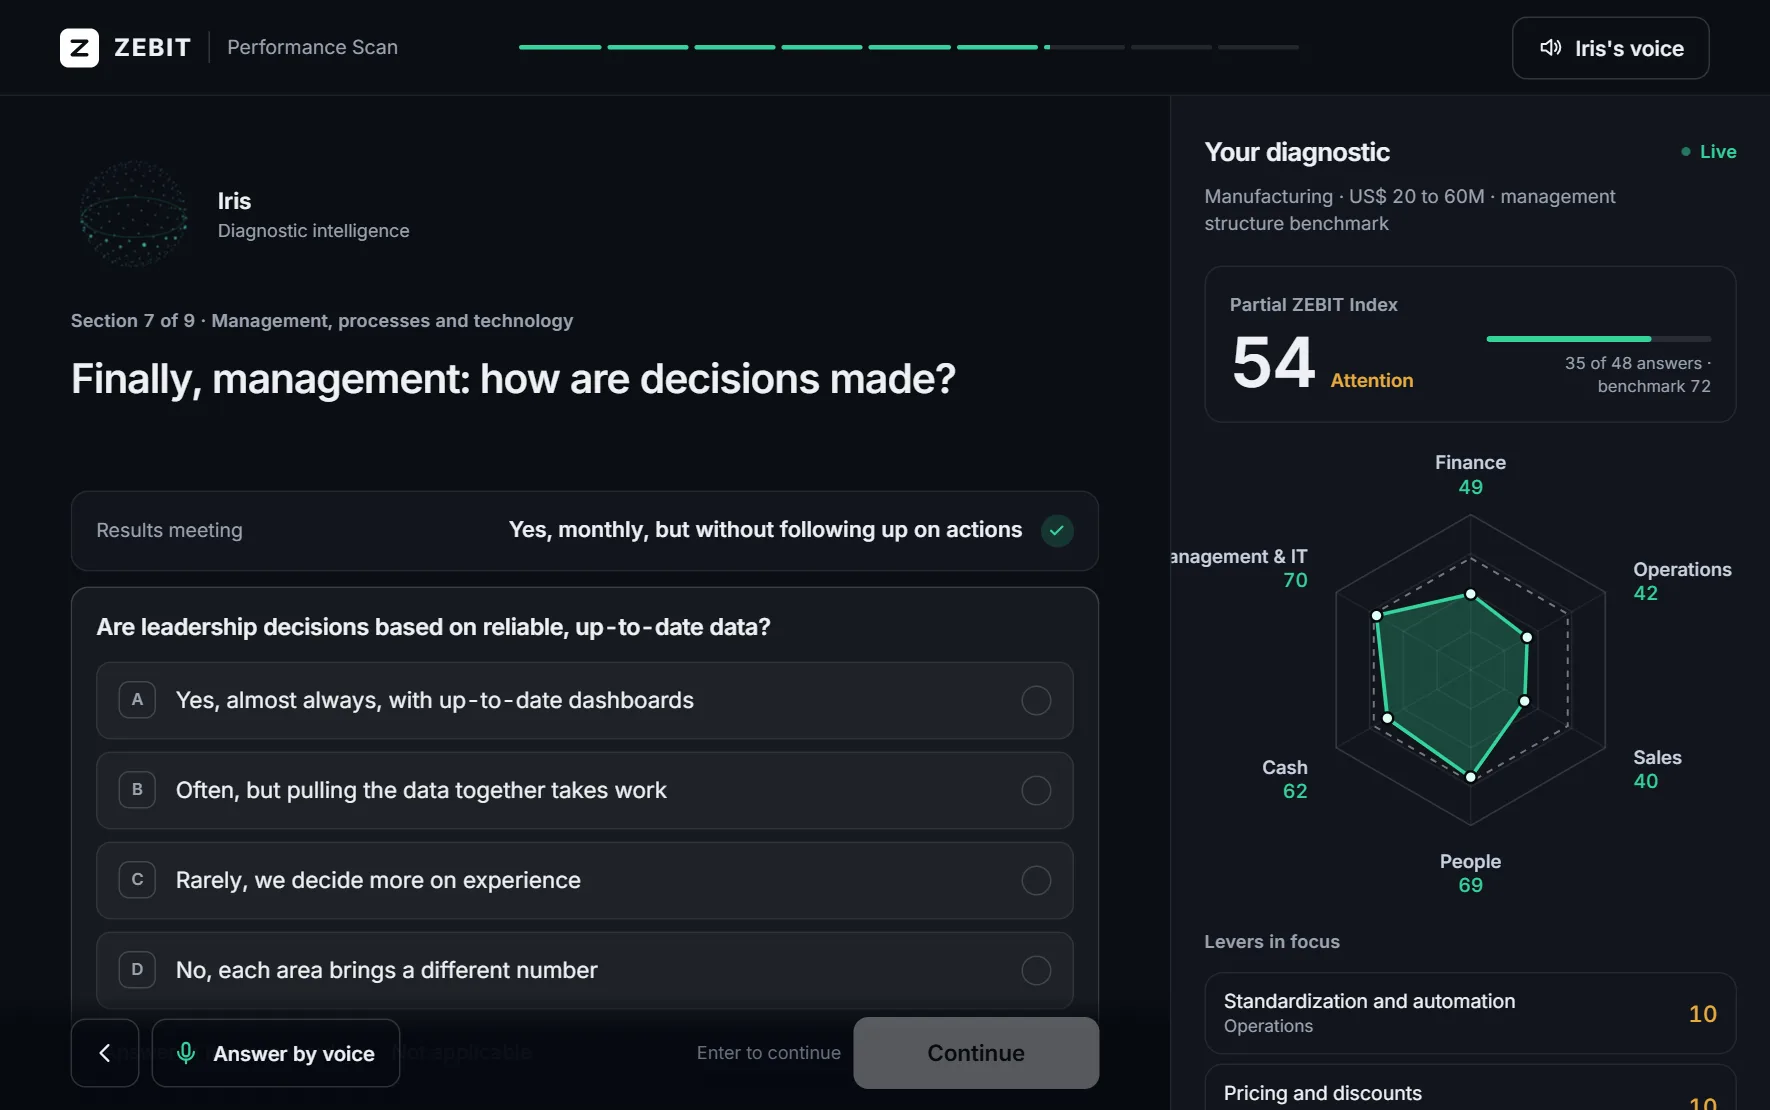
With each answer the index moves, the radar takes shape and signals appear, backed by evidence from your own answers.
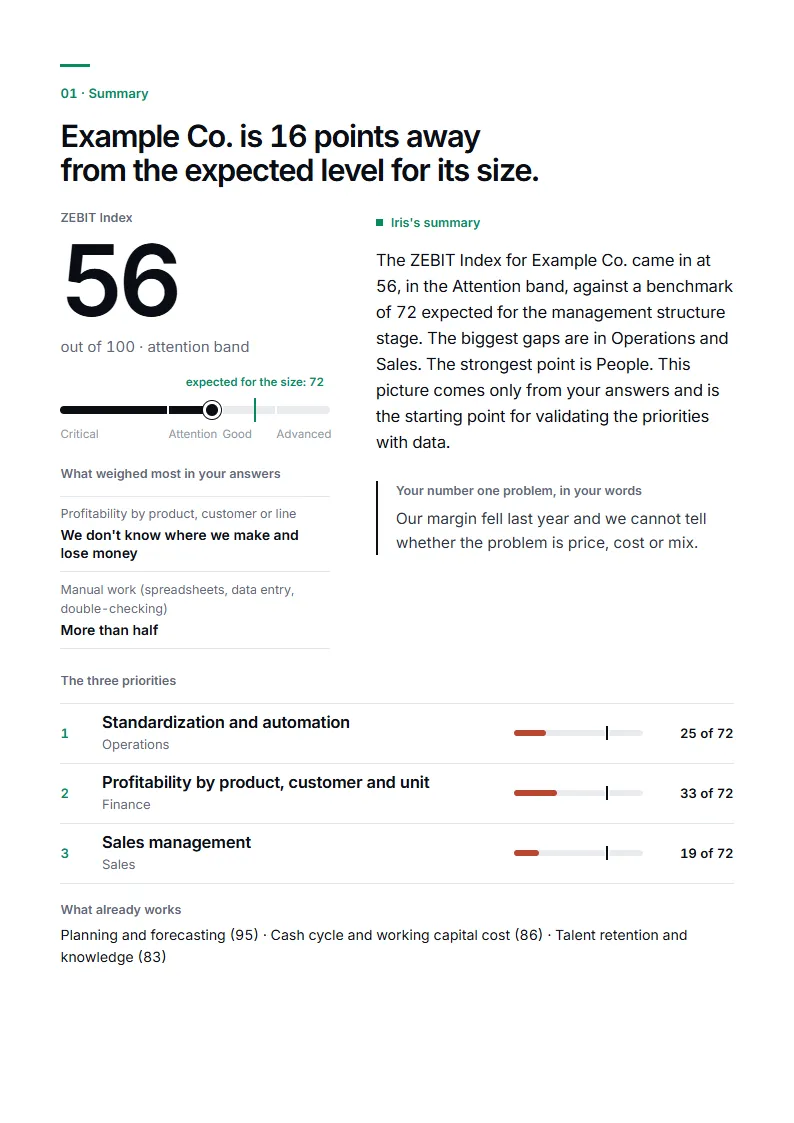
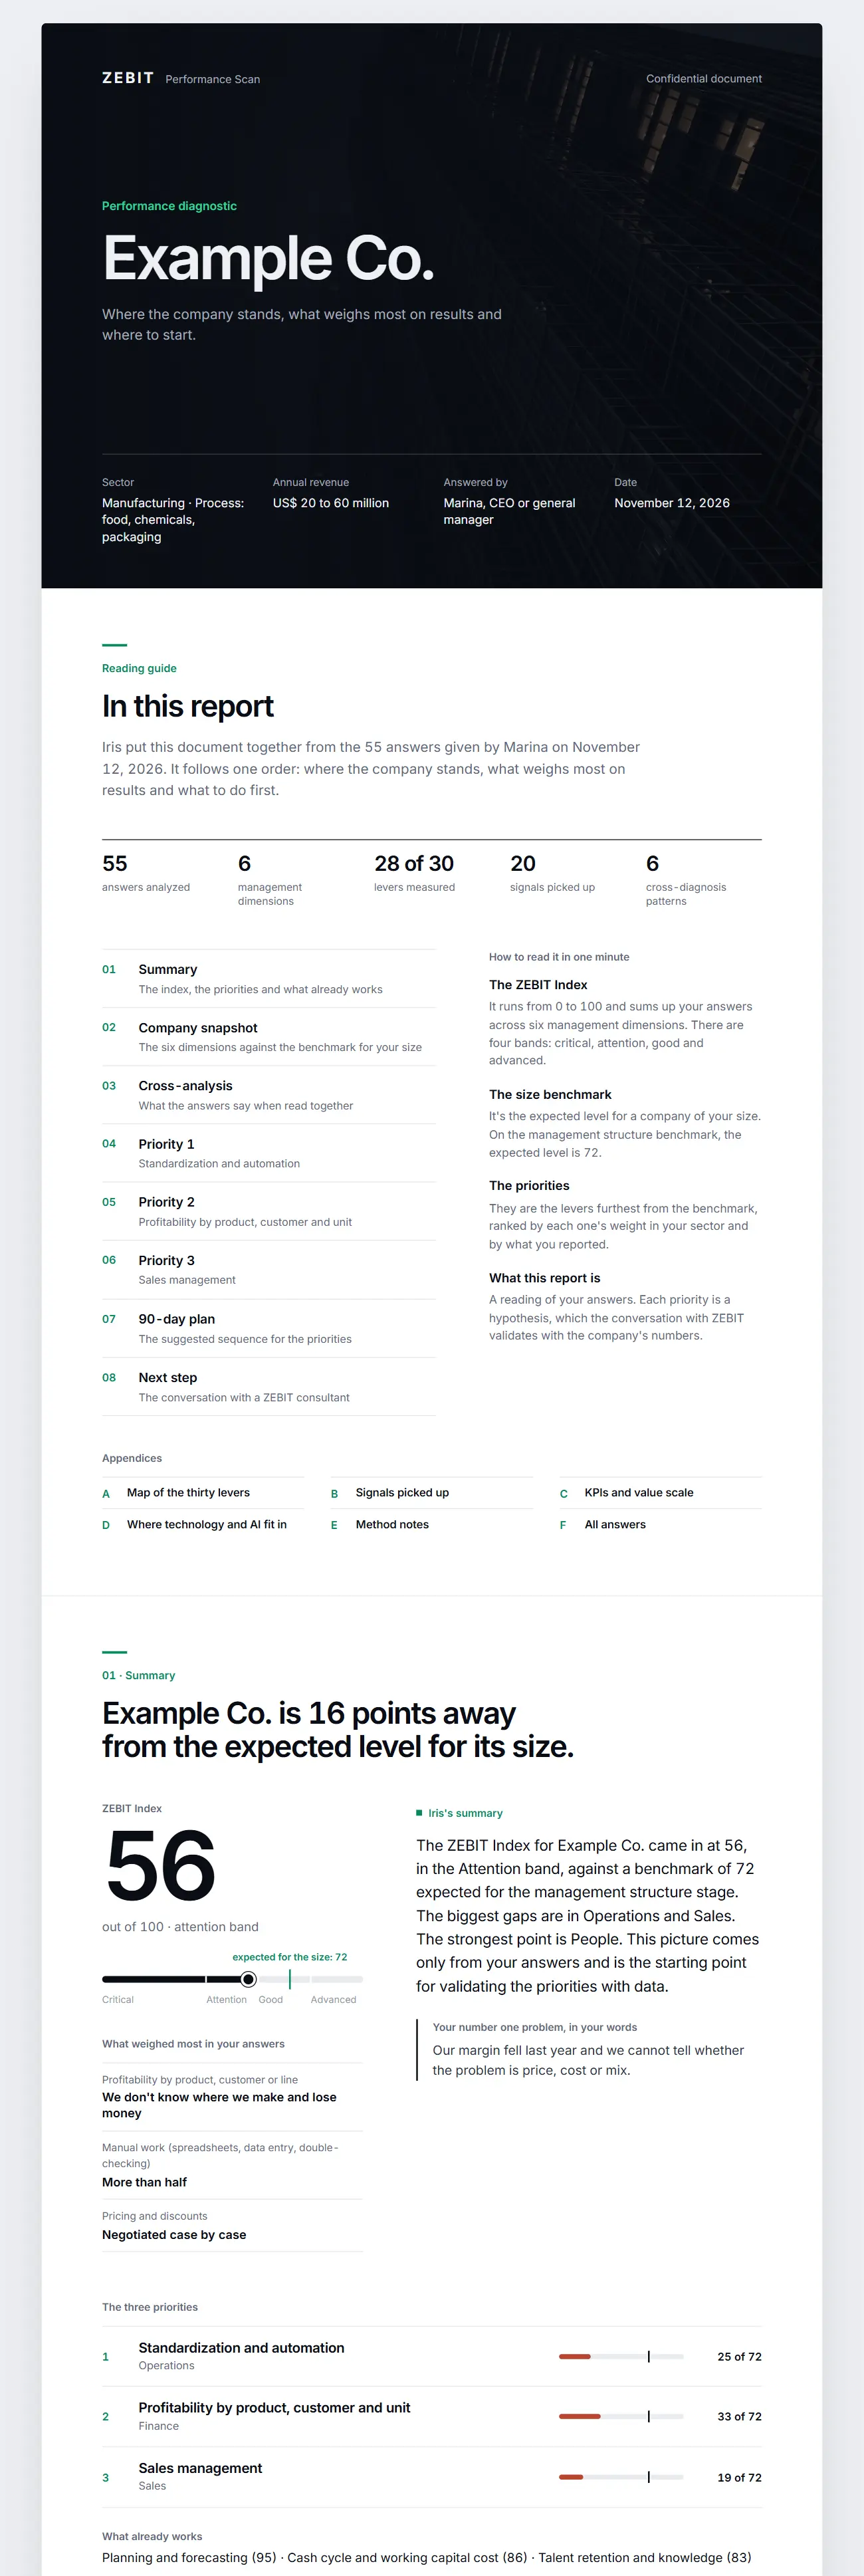
Executive summary, a map of the thirty levers, three priorities with your sector's playbook and a 90-day roadmap. On screen and as a PDF, to share with your partners.
What you get
Cover, summary, a snapshot by dimension, a map of the thirty levers, priorities, a 90-day roadmap and an appendix with every answer. A document for the leadership team's agenda.
A snapshot of the six dimensions against the benchmark for your size.
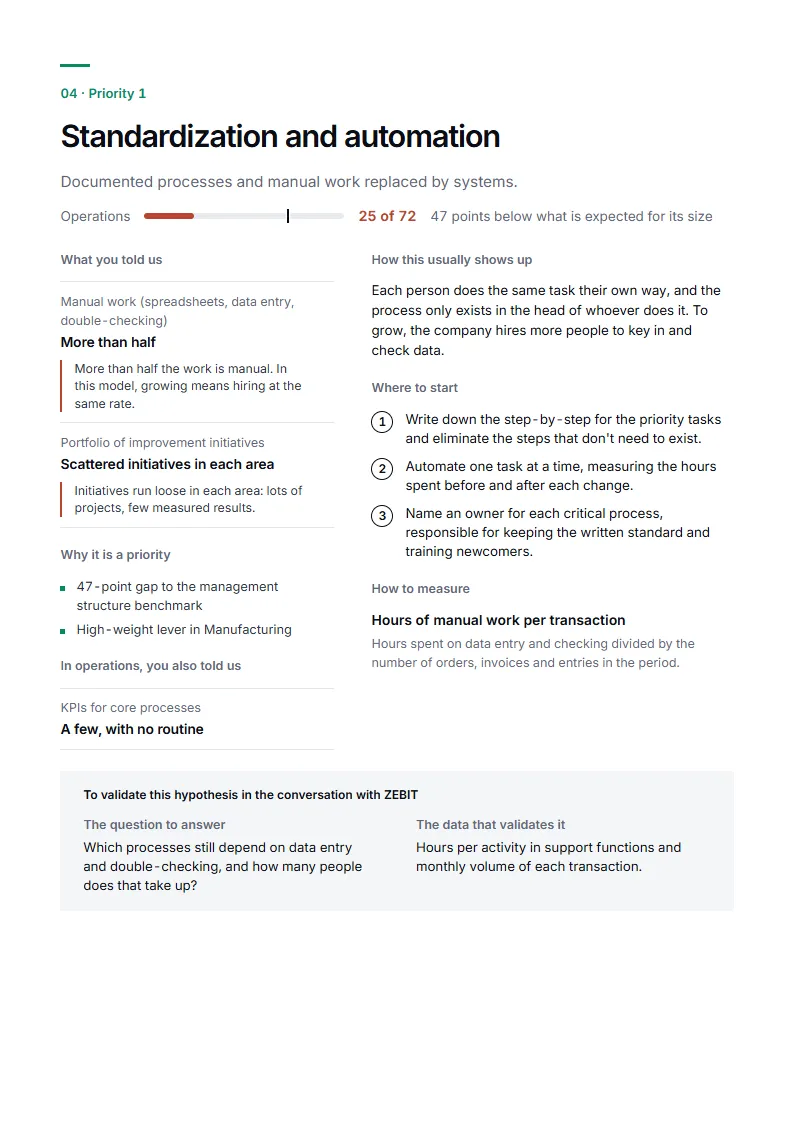
The levers with the biggest gap and the most weight in your sector. For each one, the evidence from your answers, how the problem shows up in the sector, how to tackle it and the KPI.
For each priority, the 30-day first step, the sequence up to day 90 and the agenda for the next meeting: the question to ask and the data that validates the hypothesis.
Patterns that only appear when the answers are read together. Always framed as a hypothesis to validate with data.
What each unit of improvement is worth, using the arithmetic of the ranges you provided. Math, not a promise.
The most mature use cases in your sector, tied to your priorities, in the right order: data first, then technology.
If it makes sense, a ZEBIT Partner, an executive who has held the CEO or CFO seat, discusses the result with you.
Screens and figures from a sample diagnostic.
ZEBIT Method
It's not a form with a score at the end. Each question measures a lever that drives results, is weighted for your sector, compared with the benchmark for your size and read together with the others. The method was designed by executives who have sat in the CEO and CFO chairs.
Hover over a lever to see what it measures.
Every practice is described in four steps, in the language of people who run companies. Pick a step and see what the method records.
Sector and size
Results are won and lost in different places. Questions, vocabulary and weights change with the sector, and the expected level rises with revenue.
Four size benchmarks. Each lever's gap is measured against the benchmark for the company's stage.
Our commitment
Estimates guide decisions. We don't promise gains before validating data, assumptions and execution capacity with you. The scan ends with priorities, evidence and an agenda, never with a magic number.
Frequently asked questions
Yes. The scan and the report are free and carry no commitment. If it makes sense, you can request a conversation with a ZEBIT executive at the end of the report.
Ten to twelve minutes. Your answers are saved in this browser: you can pause and continue later.
No. The questions use ranges and descriptions of practices. You can always answer that you don't know, and that is part of the diagnostic too.
Yes. Iris asks the questions by voice and you answer by tapping an option or speaking in your own words. What you say is saved and goes into the report. If a question doesn't apply to your company, just mark it as not applicable.
The method has four benchmarks, from companies still building their structure to those with revenue above US$ 200 million. ZEBIT focuses on companies with annual revenue between US$ 6 million and US$ 200 million.
You get the report right away. If you want to go deeper, a ZEBIT Partner discusses the result with you, validates data and assumptions, and builds the execution plan with the company.
Your answers generate your report and, if you ask, a contact from an executive. We follow the LGPD (Brazilian data protection law) and you can request deletion at any time. Details in our Privacy policy.
Six dimensions, your sector, your size and a report that fits on the agenda of your next meeting.
Free. No commitment. Instant report, on screen and as a PDF.
Calibrating the method
Iris